Outliers are important in statistical analysis. They can affect various statistics, such as the mean or standard deviation, which in turn can affect statistical tests, measures of correlations and the modelling of data, thus leading to distorted results and conclusions. Therefore, identifying and appropriately managing outliers by replacing them, removing them or using appropriate techniques in data analysis, is key to obtaining reliable and accurate statistical results.
What are outlier cases?
To a large extent, what we classify as an outlier depends on the definition or what method of searching for outliers we choose. A general definition of outliers means that they are values that are significantly different from others. Outliers may be the result of measurement errors, a poorly selected survey sample, or errors at the data entry stage of the file (e.g. manual coding of survey results into the dataset). It is also worth mentioning that outliers are not always a sign of errors or irregularities. They may be the result of rare events or the existence of subgroups of data with different characteristics. In some cases, outliers are valuable information that can be used to identify unusual phenomena. In data analysis, it is important to understand the context and purpose of the study in order to properly interpret outliers.
Below are three common methods for identifying outlier observations.
Identification of outliers in unidimensional data
There are many ways to identify outliers. The simplest method to indicate whether there are outliers is to prepare box plots or histograms. More accurate methods rely on appropriate statistical measures by which we can determine which values will be outliers.
Quartile spread
We will start our discussion of identification methods with the quartile range, from which outlier observations can be determined. The interquartile range (IQR) is the difference between the upper (Q3) and lower quartile (Q1) of the data[1]. A popular rule of thumb is that an observation is an outlier if it lies at least 1.5x above the third quartile or 1.5x below the first quartile. In other words, bottom outliers are those that lie below Q1-1.5⋅IQR and top outliers are those that lie above Q3+1.5⋅IQR.
The above principle also applies in the determination of the outlier cases shown in the box plot, which will be discussed below.
Standard deviation and standardisation
The standard deviation measures how much the data scatters around the mean. Values that deviate significantly from the mean, when the standard deviation is taken into account, can be considered outliers. A simple way to identify outliers would be to standardise the variable. This is a type of normalisation of a variable by subtracting from the value of the variable, its mean, and then dividing this value by the standard deviation (formula below). The result will be a new variable in which the mean is 0 and the standard deviation is 1.
The formula for standardisation for a given value (x) is as follows:

where:
Z – standardised value
![]() – value of the variable
– value of the variable
M – mean value
![]() – standard deviation
– standard deviation
For example, values that are further away from the mean by more than a certain threshold (e.g. 2 or 3 times the standard deviation) can be considered as outliers. It is also worth remembering that if the distribution of the analysed variable assumes a normal distribution or is close to it, then by applying the three sigma rule we are able to determine that observations that are within 2 standard deviations from the mean are 95.4% of the cases, and in the case of 3 standard deviations from the mean there are 99.7% of observations. The three sigma rule can be useful in identifying outlier observations. If we assume that the observations are 3 standard deviations from the mean, we know that we will reject a maximum of 0.3% of the observations of the analysed variable.
Box plot and histogram
A box plot (or box and whisker plot) is a visual tool that shows the distribution of data and outlier observations. Values that lie outside the whiskers (lines extending from the box) can be considered outliers, i.e., contain those observations that lie within 1.5 or - 1.5 of the quartile spread from the box. As can be seen in the box plot below, there are points above both the upper and lower whiskers. The circular points are the outlier cases, i.e., values that are between 1.5/-1.5 and 3/-3 of the quartile spread from the box. The star-shaped point is referred to as an extreme case and these are observations located more than 3/-3 quartile spread from the box.
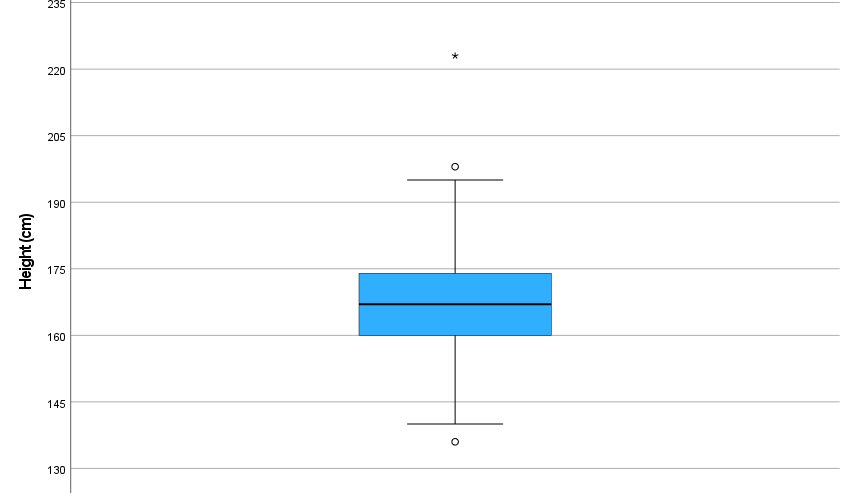
Figure 1: Box plot showing the distribution of the variable Height (cm).
As you can see, by using a box plot we have the possibility not only to visually present the distribution of a variable, but also to check whether there are outliers in the data.
A second type of visualisation that can be helpful in identifying outliers is the histogram. This graph shows the frequency distribution of the data in different value intervals (or classes). The value intervals are represented on the horizontal axis and the number of occurrences of the data in each interval is represented on the vertical axis. Values that clearly stand out and are at the extreme ends of the histogram (furthest from the rest of the data) can be considered potential outliers.

Figure 2: Histogram showing the distribution of the variable Net monthly income.
The red colour indicates potential outliers
Identification of outliers in PS IMAGO PRO
Using PS IMAGO PRO, there are several techniques available that can help the analyst to identify outlier cases. As well as box plots and histograms, there are also validation procedures and data mining techniques. A worthwhile procedure that allows you to quickly determine, based on your own specifications, which observations are to be counted as outliers is Data Audit.
By going to the Predictive Solutions menu and selecting Data Audit, we indicate which quantitative variables we want to analyse. Then, in the options, under Outliers, you can indicate the statistics on the basis of which outliers are to be identified. The range of outliers additionally allows you to define above/below how many standard deviations from the mean or above/below how many quartile intervals a given value will be classified as an outlier.
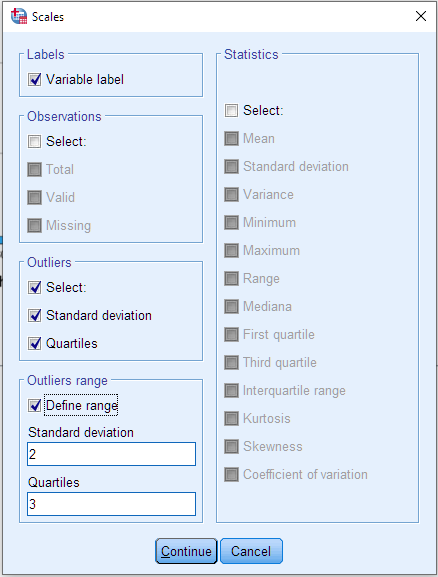
Figure 1: Statistics selection window for quantitative
variables in the Data Audit procedure
In this example, I will use the variable concerning the number of years the respondent has spent in education. Then, in the options for quantitative variables, in the Outliers area, I select the standard deviation and the quarterly range. I leave the other options unchanged. As a result, I get a table that tells me how many observations according to the indicated criteria are counted as outlier cases.
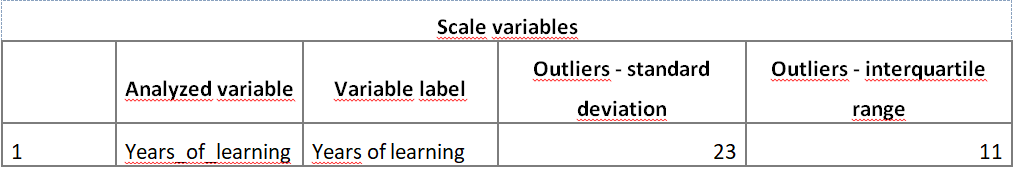
Table 1. Resulting table of the Data Audit procedure showing the number of outliers identified
Summary
Outliers are unusual observations that differ from the rest of the data. There are many methods to identify outliers, such as standardisation, interquartile range, box plots or histograms. The interpretation of outliers depends on the context and purpose of the study. They are not always a bad thing, but can be significant in the analysis of the data, affecting the statistical results and the conclusions drawn from them. It is important to pay attention to potential outliers when embarking on data analysis and to assess whether they need to be addressed so that the results obtained are accurate and reliable.
[1] Quantiles, quartiles, percentiles (measures of location) - Predictive Solutions