In practice, the simplest and most commonly used type of regression is the linear regression model, whose parameters are estimated using the Least Squares Method. However, linear regression is only used to predict a continuous variable, but what if we want to predict a variable that has only two values?
It is not uncommon for an analyst to be faced with the challenge of predicting various events, e.g., whether a person will repay a loan he or she has taken out, whether a customer will abandon a particular company, or whether an email is spam or not. The event we want to predict (the dependent variable) is a zero-one event - something will or will not occur. The analyst's solution in such situations will be to use logistic regression, in which the dependent variable has only two values.
How do we understand probability and chance?
Logistic regression is a technique based on the probability and chance of an event occurring. Probability and chance in statistics are two different concepts and it is necessary to understand the difference between them in order to correctly use the logistic regression model in analyses.
Probability indicates the certainty of the occurrence of a phenomenon. It is calculated on the basis of the frequency of occurrence of a given event among all possible events. The probability (or odds) is the ratio of the probability of an event occurring to the certainty of the opposite event occurring, i.e., the ratio of the probability of an event occurring to the probability of it not occurring ![]() . Like probability, chance takes values from 0, but no longer limited to 1. A chance value of 1 means that an event is just as likely to occur as it is to not occur. It takes values up to infinity and, consequently, its distribution is characterised by high asymmetry. To obtain a measure with a symmetrical distribution, we use the natural logarithm of the odds, the so-called logit, which takes both positive and negative values and gives rise to the logistic function.
. Like probability, chance takes values from 0, but no longer limited to 1. A chance value of 1 means that an event is just as likely to occur as it is to not occur. It takes values up to infinity and, consequently, its distribution is characterised by high asymmetry. To obtain a measure with a symmetrical distribution, we use the natural logarithm of the odds, the so-called logit, which takes both positive and negative values and gives rise to the logistic function.

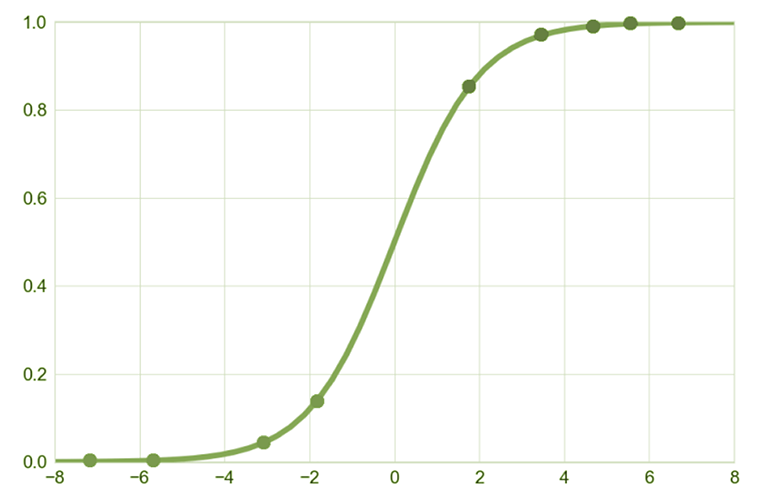
Figure 1. Logistic regression function
The simple form of a logistic regression model with a single explanatory variable is thus as follows:
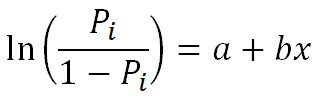
where:
![]() – natural logarithm of chance,
– natural logarithm of chance,
a – free parameter,
b – logistic regression coefficient,
x – explanatory variable
A logistic regression model (as opposed to a linear regression model) is not designed to explain the dependent variable itself, but to determine the probability of an event occurring (the dependent variable taking the value '1'). The result of logistic regression will therefore be to determine whether a change in the value of the explanatory variable predicts a lower or higher probability of an event occurring.
Independent variables in a logistic regression model
The independent variables in a logistic regression model can be both quantitative and qualitative variables. However, when including qualitative variables in the model, it is necessary to 'treat' it appropriately. Such a variable needs to be coded appropriately - for example, women are assigned a value of '0' and men '1'. We then need to decide which category of qualitative variable will be our reference point - whether we are interested in interpreting the results for men compared to women or vice versa. If the qualitative variable had more than two categories then we also indicate which category will be our reference category in the analysis.
Logistic regression assumptions
Before going on to analyse logistic regression, as with any statistical technique it is important to check that its assumptions are met. Logistic regression has relatively few assumptions compared to multiple regression. Here are some of them:
- Binary form of the dependent variable,
- No correlation between the independent variables,
- A linear relationship between the logit of probability and the independent variables, (the natural logarithm of chance is linearly dependent on the explanatory variable),
- Inclusion in the model of only those independent variables that have a significant effect on the dependent variable.
An example of the practical use of logistic regression
We will now look at the possibility of using a logistic regression model to predict whether a person will renew a contract with a telecoms provider. An example of the use of logistic regression was prepared in PS IMAGO PRO.
The dependent variable in the analysis is the variable indicating whether the person has renewed the contract for telecommunication services with a certain company (where '1' - will renew, '0' - will not renew). From the frequency table, we can see that there are a total of 200 people in the dataset. The contract was renewed by 95 people which represent 47.5 % of all people with a contract with a certain service provider.
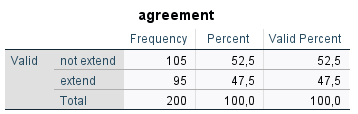
Table 1. Frequency table of the contract renewal variable
The variables we will want to introduce into the analysis as predictors are: gender, age, and a variable indicating whether the subscriber received a phone in the service price when signing the last contract.
After entering the dependent variable and the predictors into the logistic regression procedure in PS IMAGO PRO, we obtain results divided into two blocks. In the first one, we obtain statistics for the model containing only the constant, while in the second one we already obtain statistics for the model with the introduced predictors. The classification tables obtained in the results indicate the percentage of correct classifications of cases based on a given model (comparison of observed and predicted frequencies).
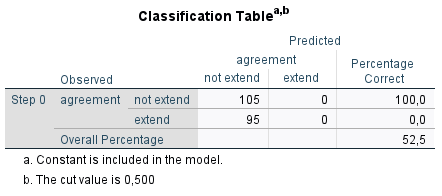
Table 2. Classification table for logistic regression model
with constant only, no predictors
From the table (Table 2), we see that if only a constant is included in the analysis, the model will predict correctly around 53% of the cases (percentage of total correct classifications). This is not much better than the flip of a coin if we wanted to predict a customer leaving or renewing a contract in this way.
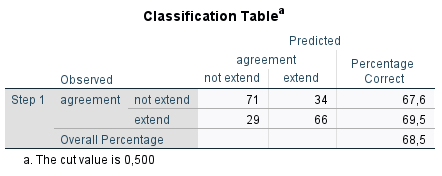
Table 3. Classification table for logistic regression model
with constant and introduced predictors
After including predictors in the analysis, the model performs better in classifying cases. The percentage of correct classifications increased from around 53% to almost 69%. The model correctly identified 66 out of 95 people (69.5%) who renewed their contract with the provider. It was wrong in the case of 29 individuals. And similarly for those who did not renew their contract, the model correctly classified 71 out of 105 cases (67.6%).
Statistics indicating the goodness of fit will be the -2 log-likelihood statistic, the Cox-Snell R-square and the Nagelkerke R-square shown in the table below.
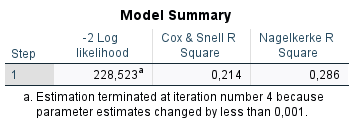
Table 4. Summary of the model
The -2 logarithm reliability statistic indicates how much difference there is between a model containing only a constant and a model with predictors included. The higher the value of this statistic, the greater the discrepancy between the models (i.e. predictors were rightly introduced into the model).
The statistics presented in the Model - Summary table, take values from 0 to 0.75 (Cox and Snell) and 1 (Nagelkerki). These are measures that mimic the R-square known from linear regression, often referred to as the pseudo R-square. The interpretation of these values is analogous to the R-square known from linear regression.
Finally, let us look at the table showing the variables included in the model together with their significance levels[1]. From the column containing the significance levels, it can be seen that not all variables included in the model are significant predictors of contract renewal. The variable indicating whether or not the person received a phone at the service price when signing their last contract is not statistically significant (significance > 0.05).
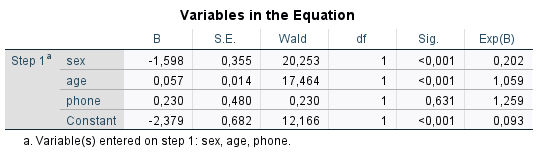
Table 5. Parameters of the logistic regression model
predicting the renewal of a telecoms contract
Let us consider what is meant by a negative B coefficient with the gender variable. In our example, men have been marked with a value of '1' and women with a value of '0'. We are analysing men compared to women. A negative B coefficient here means that the chance of a man renewing his contract is lower than the chance of a woman renewing hers.
If we want to find out how much smaller this chance is, we refer to the odds ratio value shown in the last column of the table - Exp(B). The odds ratio in logistic regression is a key concept in the context of interpreting the results. It defines the change in the chance of the value of a given explanatory variable occurring when the explanatory variable increases by 1 unit, assuming that the rest of the independent variables remain constant. We calculate the odds quotient ![]() as the ratio of the chances of a given event occurring in two groups. Because of the values taken, it is interpreted as follows:
as the ratio of the chances of a given event occurring in two groups. Because of the values taken, it is interpreted as follows:
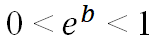 – the negative impact of a variable on the occurrence of an event,
 – the lack of influence of a variable on the occurrence of an event,
 – positive impact on the occurrence of the event.
The odds ratio value for the gender variable is 0.202 and informs us that men are 80% less likely to renew their contract compared to women.
Age is the second significant predictor for predicting contract renewal. The B-value for age is 0.057, while the odds ratio is 1.059, which means that as the person's age increases by 1 year, the chance of contract renewal will increase by 1.059 times.
Finally, let's look at the classification table for the logistic regression model with a constant and the predictors age and gender introduced (the insignificant variable phone was excluded). Note that excluding the insignificant variable from the analysis resulted in an increase in the percentage of correct classifications to approximately 71%.

Table 6. Classification table for the logistic regression model
with a constant and predictors age and sex
Summary
Logistic regression analysis is a statistical technique that we can use in many scientific and business areas. The dependent variable in a logistic regression model is a binary variable, while the predictors can be both continuous and categorical variables.
Logistic regression allows the impact of multiple independent variables on the chance of an event occurring to be assessed. It is commonly used in medicine, e.g., to identify risk factors for post-operative complications, the occurrence of a certain disease entity, or in banking to estimate credit risk, etc.
[1] The significance level below which predictors were assumed to be statistically significant was set at 0.05.