Check also:
Entropy is a measure of disorder or uncertainty in a probability distribution. The concept was first introduced in 1854 by the physicist Rudolf Clausius, dealing with thermodynamic issues, and in this sense the definition of entropy refers (in a nutshell) to the course of spontaneous processes. Today, the concept of entropy also has its application in statistics. This is because it allows us to determine a kind of heterogeneity in a set of data.
Entropy in statistics
When analysing qualitative variables, the measure of entropy gives us information about how much variability (and therefore 'disorder') is introduced by the individual variables. We get an indication of the degree of randomness of individual qualitative variables. Entropy was introduced into the field of statistics on the basis of information theory, and one of its most commonly used measures is the "Shannon entropy".
If the entropy score is 0, it means that the variable takes on only one value. Such variables are called constants: they do not allow for any additional information.
The higher the entropy score, the greater the variety of categories that the variable takes. The result will depend on the number of unique categories of the analysed variable and the frequency of their occurrence with respect to all observations. The value of entropy, on the other hand, does not depend on the size of the Dataset: if a variable has four categories, representing respectively 40%, 30%, 20% and 10% of the distribution, the entropy will have the same value, regardless of whether we have 10 or 10000 observations.
Percentage entropy
The resulting entropy can also be presented as a percentage compared to its maximum value. Reaching the largest possible value (100% of the maximum entropy value) tells us that all values of the variable are equally likely. Such a case is when, in a given set, each observation has a different score (category) of the analysed variable, or all its categories are otherwise equal.
As the entropy value in itself is not easily interpretable, it is useful to present this result in percentage form. In so doing we then know that the maximum value is 100% and this is our reference point for interpreting the result obtained.
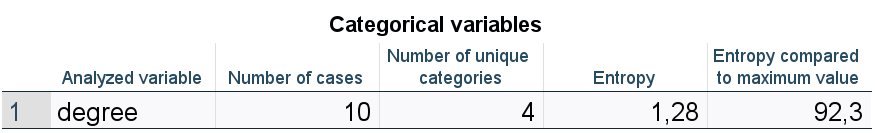
Table 1. Entropy results for the analysed variable
Let's look at the example shown in Table 1 where the entropy for the analysed variable of college degree completed is 1.28. This result is not close to 0, so there is certainly some disorder or uncertainty in the distribution.
However, if we do not know the entropy results for other variables, in order, for example, to select for analysis those that will introduce the most variability, the value of 1.28 alone will tell us little more.
Knowing that this result, compared to the maximum value, represents 92.3%, gives us additional information that there is significant variation in both the values of the variable and the Abundance of the individual categories.
How to obtain an entropy value
If we know the entropy measures for the individual quality variables, we can use them as an indicator of the importance of the variables. Such information can be used, for example, in modelling or classification. The entropy value can be obtained using the Data Audit procedure in PS IMAGO PRO. All analysed qualitative variables are summarised in a single table, which allows you to quickly compare the results obtained and select the most promising variables for your model.
But how exactly is entropy calculated? As we have already seen, the number of unique categories of a variable and their contribution to the variable's distribution is key. The Shannon entropy formula, the most commonly used formula for the entropy of a qualitative variable, is as follows:
H(X) = - Σ p(x) log_2 (p(x)),
where H(X) is the entropy of the variable X and p(x) is the probability of occurrence of the value of x.
The entropy that is obtained in the Data Audit procedure in PS IMAGO PRO (Table 1) is calculated based on the natural logarithm. Its formula is therefore as follows:
H(X) = - Σ p(x) ln(p(x)),
where H(X) is the entropy of the variable X and p(x) is the probability of occurrence of the value of x.
To make this formula more understandable, let us illustrate it with an example. We want to calculate the entropy for the qualitative variable college degree completed (X = degree). Our dataset consists of 10 observations: 4 bachelors, 3 engineers, 2 masters and 1 doctorate (Figure 1). The probability of belonging to the bachelor's category is 40%, so the first part of the equation will be 0.4×ln(0.4). Adding the subsequent elements of the formula for each category in an analogous way, we obtain the following equation:
H(studies) = - ((0.4×ln(0.4)) + (0.3× ln(0.3)) + (0.2×ln(0.2)) + (0.1×ln(0.1)))= 1.28
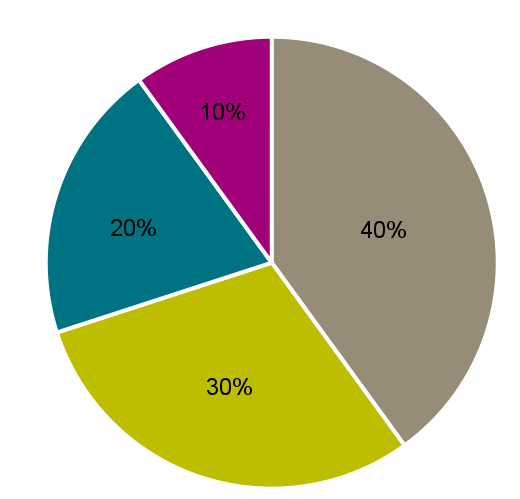
Figure 1. Distribution of categories of the variable college degree completed
The maximum entropy value is ln(n), where n is the number of categories of the qualitative variable in question. In our case, the qualitative variable has 4 categories, so the maximum entropy value possible is ln(4) = 1.39.
If we wanted to present the entropy result compared to the maximum value, it would be rounded to 1.28 ÷ 1.39 = 92% (Table 1).
Summary
Entropy is a measure of uncertainty or disorder in a probability distribution. One of its most commonly used measures is Shannon entropy. A maximum value of entropy is reached when the distribution is uniform, while a minimum value of 0 is reached when the distribution is deterministic.
However, bear in mind that the base of the logarithm by which entropy is calculated can take different values, e.g., 2, in the case of the Shannon formula, 10, or ℯ (Euler number, Neper number) when the natural logarithm is used. If you want to compare results for several variables, you need to be sure that the base of the logarithm used in the formula is the same. Alternatively, entropy results can be compared with each other compared with the maximum value: such values expressed as a percentage are definitely easier to relate to each other.