What is the R² coefficient?
Mathematically, the coefficient of determination R² is simply the value of the r-Pearson correlation coefficient squared. For this reason, the R² coefficient takes values from 0 to 1. You can also easily calculate its percentages by multiplying the result by 100%, for example, R² = 0.55 = 55%.
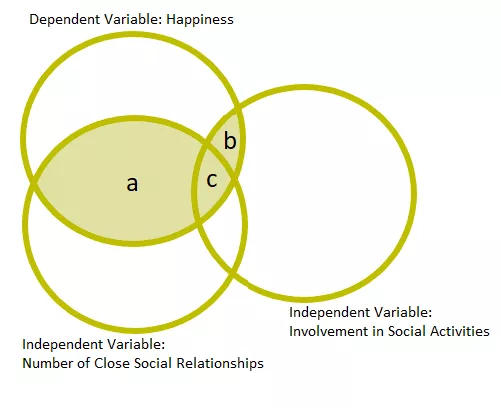
The R² value tells us what percentage of the variation in the dependent variable is explained by the variation in the independent variable. Let's see this with a simple example (Figure 1). The diagram shows a regression model in which three variables are analyzed: sense of happiness (dependent variable), number of close social relationships and involvement in social activities (independent variables).

Fig.1 Example of the relationship between the independent variables and the dependent variable in the regression analysis.
Sense of happiness is significantly explained by the number of close social relationships (box a) and to a slightly lesser extent by involvement in social activities (box b). There is also some collinearity between the two independent variables (box c).
Let's assume that the value of the coefficient of determination of this model is R² = 0.42. This entire model explains about 42% of the variance in the happiness scores (represented by the shaded boxes). Thus, there is still 58% of the variance that is explained by some other variables.
Interpretation of the value of the coefficient of determination R²
We interpret the value of the coefficient of determination as follows:
- R² = 1: The model fits the data perfectly. All data points lie on the regression line.
- R² = 0: The model does not explain any variation in the dependent variable. All predictions are equal to the mean value of the dependent variable.
- 0 < R² < 1: Some of the variability is explained by the model, but there is also unexplained variability. The closer to 1, the better the fit of the model to the data.
However, it is worth noting that a high R² value does not always mean that the model is good. R² only tells us about the model's fit to the data, but it does not tell us whether the model is substantively sound, whether the independent variables actually affect the dependent variable in a causal way. R² also does not allow to assess the quality of the model. You can read about the basic assumptions with examples in the article on the r-Pearson coefficient.
Limitations of the R² Factor
However, the R² coefficient has its limitations. One of the main ones is that it does not take into account the number of variables in the model. Adding more variables to the model always increases R², even if these variables have no real effect on the dependent variable. In such cases, it is better to use the so-called adjusted R², which takes into account the number of variables and penalizes over-complexity in the model.
Moreover, R² says nothing about measurement errors or the distribution of residuals. Therefore, before we consider a model to be good, it is worthwhile to analyze other indicators as well, such as the mean square of error (MSE), statistical tests or graphs of residuals.
In the real world, there is always some degree of variability that is not explained by our model - it is the result of the influence of other, unidentified factors. That's why it's important not to consider R² as the only indicator to evaluate a model, but rather as one of many tools that help us understand our data.
Summary
The coefficient of determination R² is an invaluable tool in data analysis, allowing us to quickly and efficiently assess how well our model predicts results. But Keep in mind that-even if the R² looks impressive, it's always worth looking deeper and considering other possible factors that may be influencing your data. After all, data analysis isn't just about numbers, it's about understanding what's really behind those numbers.