What is the median?
The median is one of the measures of central tendency, which is the measure that describes the middle value of the analyzed variable. It defines the value that divides the data into two equal parts - half of the observations are less than or equal to the median, and half are greater than or equal to the median.
The median is also referred to as a positional measure, since it is based on the position of values in an ordered set of data, rather than their magnitudes. What does this mean? To find the median, the data must first be ordered in ascending or descending order. For an odd number of observations, the median is the value that is exactly in the middle. But what about when the number of observations is even? For such a variable, it is also possible to determine the median, namely by calculating the arithmetic mean of the two middle values.
Are the median and the mean the same thing?
Both statistics are measures of central tendency, but they are definitely not the same thing. The median, for example, can be determined for an ordinal variable, whereas the mean can only be calculated for a quantitative variable. The median and mean of a symmetric distribution will be close to each other, however, for skewed distributions, the position of the mean and median, as well as the mode, will be in a different place (see Figure 1). Another property of the median is that it is immune to outliers since it does not depend on individual values, but on the number of observations in the variable. Therefore, the median may be a measure that better reflects a typical value in the analysis of income, house prices and other data where there are outliers. The mean, on the other hand, will be better used where the data is symmetrical or does not have extreme values, such as average temperature.

How to calculate the median?
Now let's look at the formulas for calculating the median.
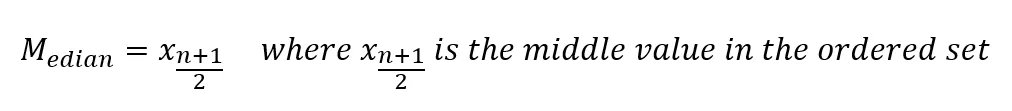
- If the number of observations is odd:
- If the number of observations is even:

Let's look at an example. We have a set of seven numbers: 10, 6, 9, 1, 8, 32, 2. To determine the median, we first sort the numbers in ascending order from lowest to highest. The sorted numbers are: 1, 2, 6, 8, 9, 10, 32. The median is the middle number. Since there are seven numbers in the set, the fourth number is the median. In our example, it is "8". Note that the median is different from the mean. The arithmetic mean for this set is 9.71.
Now let's look at the situation in which the set of numbers is even. In this situation, the median is the average of the two middle numbers. The second set of numbers are: 8, 3, 10, 2, 9, 3, 1, 4. To determine the median, we first sort the numbers as before: 1, 2, 3, 3, 4, 8, 9, 10. Within this set of eight numbers, the two middle numbers are 3 and 4. The median in this example is the average of these two numbers, which is 3.5.
How to calculate the median in PS IMAGO PRO?
For small datasets, manually determining the median is not difficult. If, on the other hand, we have several hundred values in the variable for which we want to determine the median, sorting them can be a challenge. An indispensable tool in this kind of analysis is PS IMAGO PRO, which is a comprehensive analysis and reporting solution.
When conducting preliminary data analysis, the analyst will often use descriptive statistics, including measures of central tendency. In PS IMAGO PRO, the analyst has a variety of techniques to obtain these kinds of statistics. In some cases, depending on the procedure chosen, he will receive a very extensive set of descriptive statistics (e.g., the Explore procedure), in which, among other things, there will also be the median. In another procedure (e.g. Frequencies), it will be up to the analyst to decide which measures to display.
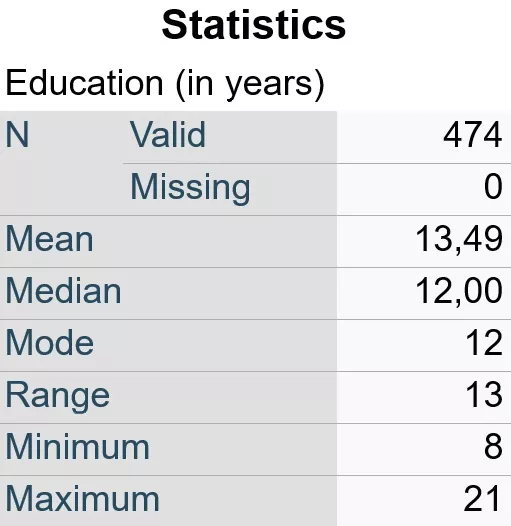
Fig. 2: An example of the result table of the Frequencies procedure showing, among other things, the median
Summary
The median is one of the basic statistical measures which we classify as a measure of central tendency. It is worth remembering that this measure is not susceptible to outliers, thus it will be applicable to highly skewed distributions. It is also easy to calculate, but before determining this measure yourself, it is important to remember that the values of the analyzed variable are first sorted in ascending or descending order.