PS IMAGO PRO is an integrated tool for the implementation of tasks in the field of statistical data analysis, reporting, automatic data processing, or Business Intelligence. It combines the IBM SPSS Statistics analytical engine with proprietary tools for creating reports and publishing results. With this holistic approach, PS IMAGO PRO users can complete the whole process of data analysis in one friendly environment.
Benefits
Data analysis standard
PS IMAGO PRO allows the user to perform both basic and advanced statistical analyses. It is an intuitive and user-friendly software, with enormous capabilities ranging from basic descriptive statistics to advanced modeling and machine learning techniques.
Extensive analytical capabilities
Apart from a set of statistical techniques, the PS IMAGO PRO user receives several dozen unique procedures that respond to the needs of analysts. They allow to significantly accelerate the process of data preparation as well as facilitate and deepen the analysis by means of visualization or predictor selection techniques.
Attractive visualization of results
Clear tables and graphs make results interpretation easy. PS IMAGO PRO contains a rich set of basic and custom charts as well as attractive visualizations. It also offers a wide range of dashboards designed specifically to support decision-making processes based on KPI implementation.
Free arrangement of the report
PS IMAGO PRO allows the user to prepare reports. The intuitive and flexible tool allows users to define the presentation format, while tables and charts can be enriched with comments. The finished document can be made available to recipients online or in the form of a classic document (docx, pdf).
Universal reporting platform
The ease of concentrating knowledge on different areas or projects in one place significantly improves decision-making processes. A part of the solution is a dedicated platform for the distribution of reports - it provides easy access to information while maintaining full control over user rights.
Safe publication of reports
Reports can be published in the cloud, without any additional IT resources involved. This ensures access to the data and current reports from anywhere in the world on an ongoing basis, with observance of the company's security policy.
Automation and task performance schedule
Efficient distribution and automatic updates of information are crucial in the effective operation of Business Intelligence solutions. All tasks from data acquisition to analysis, report preparation and publication of results can be carried out fully automatically - on request or based on a schedule.
Integrated research platform element
Survey data analysis is one of the most popular applications of statistical software packages. PS IMAGO PRO is integrated with the PS QUAESTIO PRO research platform, which extends the possibilities of controlling the process of data collection, partial analyses or building the report structure at an early stage of the research.
For whom?

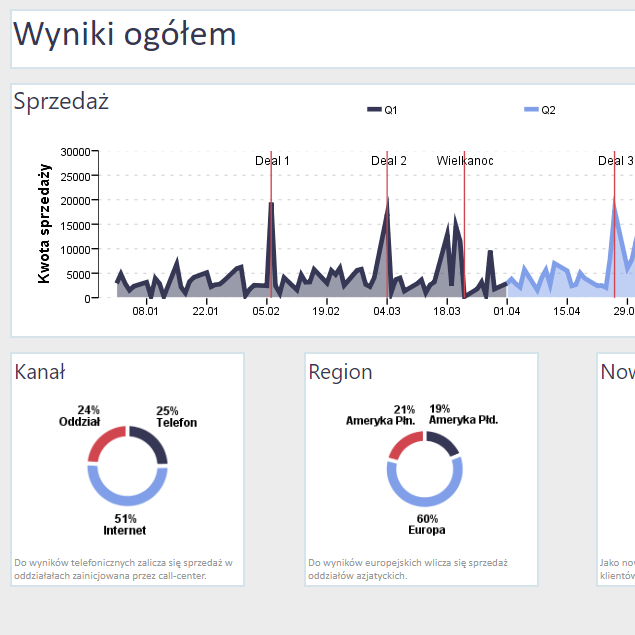
For me, sales report is one of the basic tools to work with. It allows me to assess the sales volume and structure as well as the work of the team, on an ongoing basis. It enables an immediate response to any negative phenomenon.
Analysis of sales results is a key way to verify the effectiveness of the Sales Department. Using the vendor thresholds, I can easily assess which regions are doing well and which require support action. Getting to know the sales structure and its dynamics enables quicker and more accurate decisions. It is important for me that with PS IMAGO PRO I have access to regularly updated and available results through our company's website.


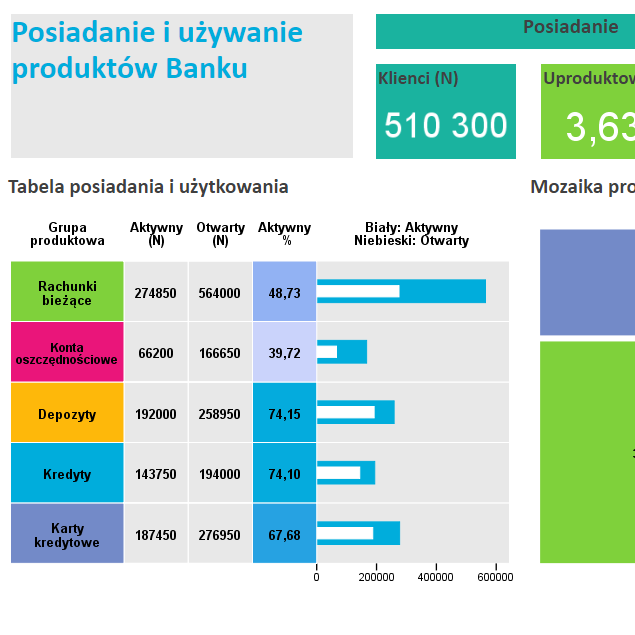
With information on product sharing, I can create relevant product or service recommendations. A well-fitted offer has a significant impact on the satisfaction and loyalty of our Customers. Understanding consumers is the basis for making right business decisions.
Using the results of the co-possession analysis, I can determine the guidelines for sales support activities on the basis of customers' shopping baskets. The analysis indicates segments where customers have slightly different needs and require tailored actions. In the analysis results, I am additionally interested in information on ways of using the products. This is crucial knowledge for activation campaigns. As a tool, PS IMAGO PRO is my bridge to providing analytical knowledge to persons making business decisions.


The quality of services provided by our company requires constant verification and control. Due to the large number of simultaneous studies, it is crucial to coordinate projects efficiently, based on monitoring indicators.
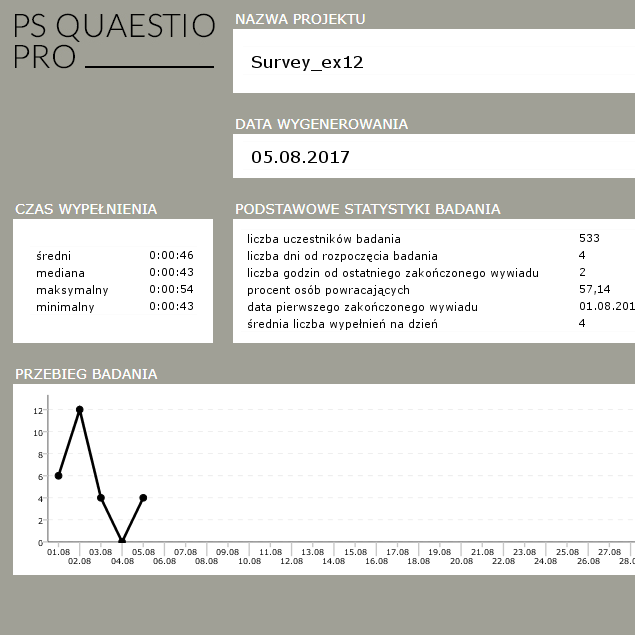
Continuous monitoring of the most important areas of activity is the basic task of my department. Our daily practice is to carry out many research projects. To deliver current results to key individuals in the organization, I need to have access to up-to-date information about the research status and the effectiveness of my efforts to improve the Response Rate index. For example, the graph that presents the course of the research allows me to easily observe moments when the additional sending of reminders increases the number of completed interviews.


The identification of factors affecting customer satisfaction is crucial to keeping the customers. The key problem here is quick and accurate identification as well as effectiveness of the company's response to any problems found.
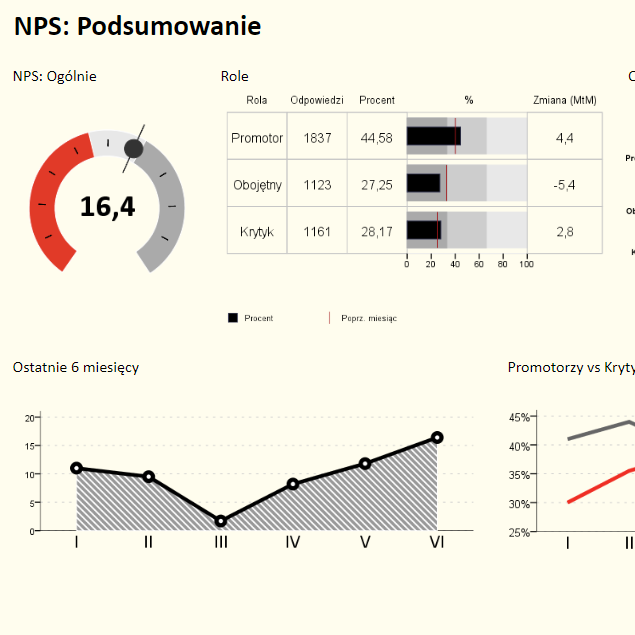
My report aims to periodically summarize customer loyalty based on Net Promoter Score. With this index, I can see the current situation as well as follow any changes in time. Subpages provide knowledge about customer satisfaction in particular regions and factors affecting customer satisfaction. Automatic updating and publication of results allows the user to focus on the interpretation and preparation of recommendations for coordinators of relevant departments instead of laborious data processing.

Offered functions
News in version 10.0
We still develop our products,
that your data will better work for you.
PS IMAGO PRO 10.0 – the comprehensive analytical and reporting solution is available now! Among the new features worth mentioning are:
- New dialog windows for all 66 Predictive Solutions menu
- New types of visualization of results
(Scale graph, Correlation map) - New procedures for data preparation
(Split data, Split text, String count) - New features in IBM SPSS Statistics 29.0.2


