Reading the article will take you:
4 minutes.
The new version of PS IMAGO PRO – Predictive Solutions’ flagship analysis and reporting solution – is now available!
New Predictive Solutions features
New windows for Predictive Solutions procedures
For all 66 procedures, including 5 new ones, new dialog windows have been prepared, which now provide, among other things:
- Sorting variables alphabetically, descending, ascending, or according to the assigned measurement level.
- Quickly switching between variable names and labels.
- Variable selection based on the measurement level.
- The ability to select all variables available in the procedure from the window interface.
- Indicating which fields of the procedure are required.
New dialog window.
New types of visualization of results
- SCALE GRAPH – a special type of bar chart used for features measured on the same scale. This type of visualisation can be employed when we want to present a set of features on a single plot that have polarized values, such as "yes" and "no," or when the scale is more elaborate, ranging from "strongly agree" to "strongly disagree," for example. It can be used for both odd scales with a central (neutral) position and even scales. This type of visualisation is useful for illustrating data derived from scales such as Likert scales, semantic differentials, or Stapel scales.

Scale graph.
- CORRELATION MAP – this visualization is used to present the relationships between multiple pairs of features on a single plot which facilitates the analysis of relationships among a large number of variables. The strength of the relationship between pairs of features is depicted using colour saturation or a red-green gradient. For ease of interpretation, you can display on the plot correlation coefficient values, variable counts, and significance levels. The procedure allows for the presentation of one of four correlation measures: Pearson's r, r squared, Kendall's Tau-b, or Spearman's rho. The user can specify a threshold value for the significance level, making it easy to filter out statistically insignificant relationships between pairs of variables.
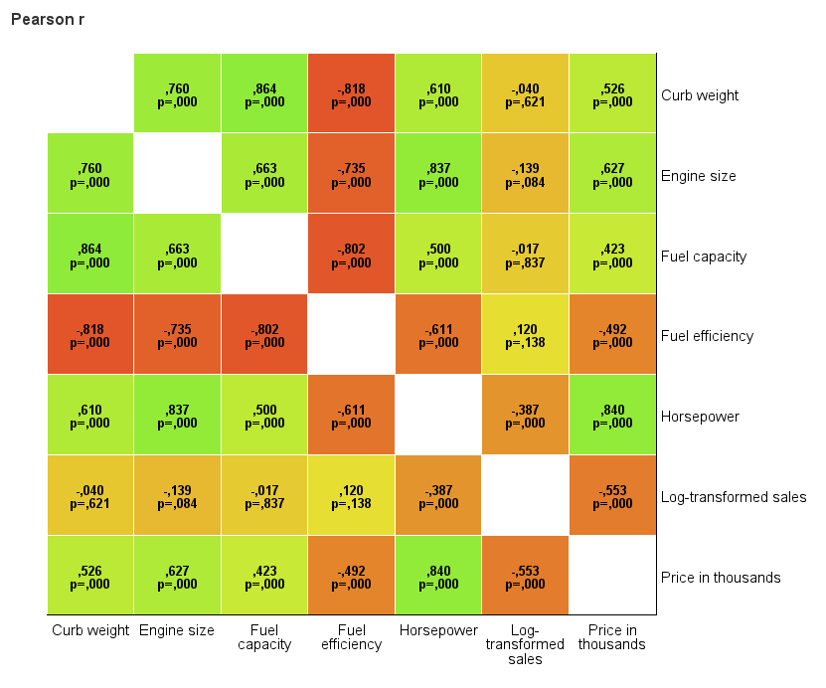
Correlation map
New procedures for data preparation
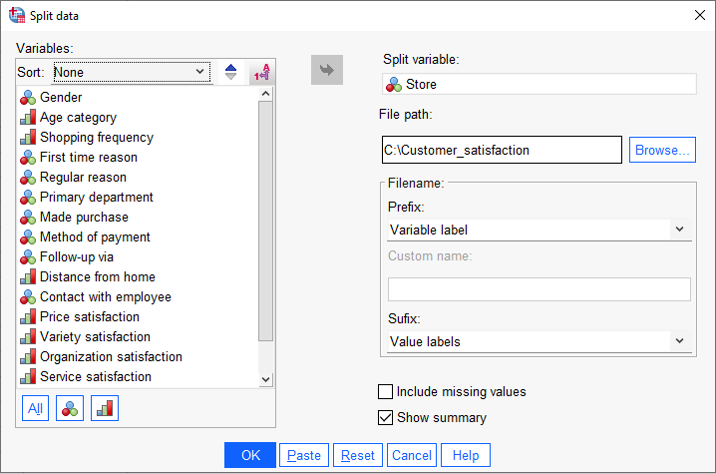
- SPLIT DATA – allows for dividing a dataset into multiple subsets without the tedious selection of data subgroups and saving each subgroup file separately. For example, if we want to divide the data by regions, we simply specify the "region" feature, run the procedure, and new data files will be created at the specified location. Each file will represent data from one region, saved in .sav format. The procedure enables flexible management of file names based on label names and values or user preferences.
- SPLIT TEXT – allows for splitting a single text variable into multiple new variables. It is particularly useful when a variable may contain more than one value in a single record, such as a list of recently purchased products separated by commas. Text variable splitting can be done in two ways. The first method involves splitting according to a specified character or a custom text string entered by the user. The second option allows for splitting the variable according to a fixed width. The procedure will create new variables with names composed of the user-specified prefix and a counter.

The result of applying the SPLIT TEXT procedure.
- STRING COUNT – tthis function is useful for analysing respondents' answers from open-ended questions or other texts to identify the frequency of occurrence of words, entire phrases, or specific character sets. It is helpful, for example, if we want to check whether terms like "room," "bathroom," "en suite," etc., appear in hotel satisfaction descriptions and how often they occur. Using this option, you can choose to check the occurrence of a specific string from a predefined list, as well as the frequency of occurrence of that sequence. The user can specify whether to consider the case sensitivity of the string.

The result of applying the STRING COUNT procedure.
New features in IBM SPSS Statistics 29.0.2
General improvements
- DATE EDITOR – the new Overview tab provides basic information about variables in the data set, along with summaries of variable types, measurement levels, missing data. Additionally, it allows access to details for individual variables using appropriate charts and summary statistics based on defined variable measurement levels.
New Analytical procedures
- PARAMETRIC SHARED FRAILTY MODELS – a new analytical procedure in the Survival Analysis menu. These models are used to analyse survival time data, especially in the case of recurrent events. These models assume that the survival time follows a known distribution, and the introduction of a frailty factor aims to account for additional variability that may arise from individual or group factors not accounted for in other variables. These models allow for the inclusion of these unobserved effects, which may improve the accuracy of survival analysis, especially when data include recurrent events.
- PERCENTILES – a new dialog box for Percentiles available in the Descriptive Statistics menu allows for the calculation of any percentiles using one of the five available methods of estimation. These options are also available under the Statistics button in the Exploration procedure.
Improvements for individual procedures
- LINEAR REGRESSION
- SELECTION CRITERIA in the Statistics window – allows for obtaining in the summary: Akaike Information Criterion, Amemiya's Prediction Criterion, Mallows' Prediction Criterion, and Schwarz Bayesian Criterion.
- TOLERANCE in the Options window – a tolerance test allows assessing whether the variables meet the minimum requirements to be included in the regression equation, considering their independence from other variables.
- PRESS (Predicted Residual Sum of Squares) residuals in the Statistics window – allows for evaluating the fit quality of the regression model.
- YOUDEN'S INDEX FOR ROC CURVES – allows for evaluating the classification of each cut point of the ROC curve, considering sensitivity and specificity.
- EXPORT RANDOM EFFECTS PREDICTIONS (EBLUPS) to datasets or files when estimating mixed models – the ability to export the contents of EBLUP result tables to data sets or .sav files in mixed model procedures (Analysis > Mixed Models > Linear or Generalized Linear).
- COX REGRESSION – the window of this survival analysis procedure has been redesigned, now allowing for the specification and calculations of multiple time-dependent covariates for Cox regression models.