What is meta-analysis?
Meta-analysis is a sophisticated statistical method. It involves combining and analysing the results of multiple independent studies on the same research problem. This allows more reliable and general conclusions to be drawn than would be possible on the basis of a single study. Meta-analysis allows the identification of patterns, differences and trends that may not be as apparent in individual studies.
Meta-analysis uses statistical methods to obtain an overall estimate of effect size, analyse differences between studies and assess the impact of publication bias and small studies on the results. What do we mean by effect size? It is a measure of the strength of a phenomenon, expressed, for example, as the standardised difference between means or Pearson's r coefficient. One of the more commonly used measures of effect size is the odds ratio, which is the ratio of the chances of an event occurring in one group compared to another.
Why use meta-analysis?
Meta-analysis is a powerful research tool that is gaining popularity in the natural and social sciences. What benefits can be gained through its use?
The main advantage of meta-analysis is the ability to combine data from multiple studies, which brings a number of benefits. One of its most important aspects is its increased statistical power. By combining the results of multiple studies, meta-analysis allows the detection of effects that may be too small to be seen in individual studies. This allows for more reliable and precise results. This is particularly important in medical and psychological research, where even small effects can be of great clinical significance.
Another advantage of meta-analysis is its objectivity and transparency. The procedure is based on precisely defined inclusion and exclusion criteria for studies, which minimises subjectivity and bias. As a result, the results of meta-analysis are more reliable and less influenced by external factors such as researcher preference or selective reporting of results.
Meta-analysis also provides a broader research context. By analysing results from different studies, it allows for a more comprehensive picture of an issue. In this way, researchers and analysts can better understand the mechanisms and phenomena they are studying.
Last but not least, meta-analysis has the potential to identify differences between studies. It allows discrepancies in results to be identified and what factors may be influencing them. This may include differences in methodology, study populations or experimental conditions. As a result, it not only provides an aggregate assessment of the results, but also helps to understand why studies may produce different results.
Meta-analysis with an analyst's eye. How to use it in PS IMAGO PRO?
In order to perform a reliable meta-analysis, appropriate statistical tools must be used. PS IMAGO PRO allows you to approach this method from several different perspectives.
The meta-analysis allows the calculation of standard effect sizes (raw data) and overall (pre-calculated) effect sizes for both binary and continuous data. Meta-analytical information, such as the effect sizes of the individual studies and the corresponding standard errors, as well as the chosen model and method of meta-analysis, is determined at the meta-analysis definition stage. This information is then automatically used in all subsequent meta-analyses performed.
When using meta-analysis to calculate standard effect sizes for quantitative data, we need to have prepared variables with information on the size of the individual studies and their mean values for the phenomenon or characteristic we are analysing. We can then decide whether to base the meta-analysis on the indicated standard deviation or variance values when comparing results. In the case of a meta-analysis of standard effect quantities for binary data, it is crucial to have variables that determine success and failure in the context of the phenomenon or feature being studied. From the perspective of business, it may be a situation of buy – not buy, and in medicine, for example, get sick – will not get sick.
In both of these approaches, we have the option to choose how the effect size is calculated. There are also many other possibilities to tailor the meta-analysis to individual needs and expectations, e.g., by defining the analysis criteria appropriately, or including a Trim-and-Fill method, estimating the number of missing studies.
If, on the other hand, we want to use the meta-analysis for already pre-calculated effect sizes, it will be crucial to have a variable with these values in the set. In addition, we need to identify the variable with the standard errors or variances calculated for the effect size - in this case regardless of whether we are analysing quantitative or binary data.
There is another, more advanced approach to meta-analysis available in PS IMAGO PRO, namely meta-regression. As the name suggests, it is based on linear regression analysis and allows us to study the influence of factors on the results obtained. In other words, it does not aim to combine the results and obtain a single measure of the overall effect, but rather to analyse the relationships between the characteristics and effects of the studies. This is because the results obtained can be influenced, for example, by demographic factors of the study participants, duration, differences in the products, services or tools used, as well as other specific conditions of the study.
From the analyst's point of view, meta-analysis, has its strengths and weaknesses. Its main advantage is that it offers greater statistical power than a single study and allows us to see whether the overall results can be applied to individual, related studies. Its main disadvantage, on the other hand, is that it is carried out after the fact - we do not have the opportunity to make adjustments in the choice of statistical inference methods or group breakdowns. It is therefore very important to carefully select the studies included in the meta-analysis and take care of their methodological quality.
Visualisation of meta-analysis results in PS IMAGO PRO
Visualisation of meta-analysis results in PS IMAGO PRO may be facilitated by appropriately selected graphs. In PS IMAGO PRO, they are available from the procedure level and include:
- Forest Plot (or blobbogram) – used to present the results of individual studies and the combined effect in a single chart, facilitating comparison and assessment of the consistency of the results.
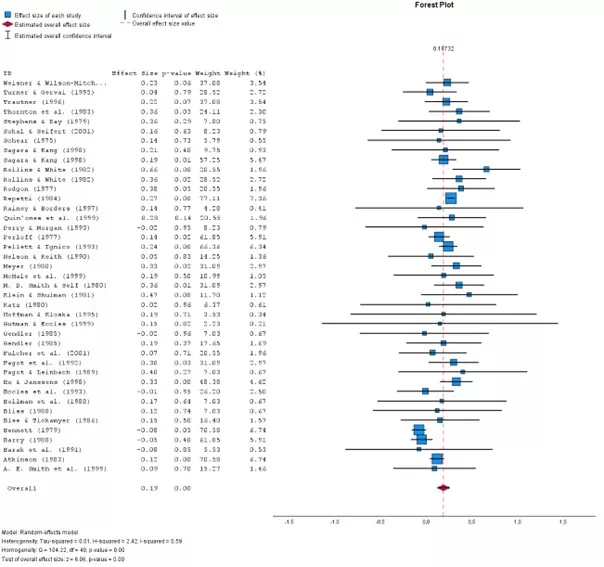
Chart 1. Forest Plot
Each line represents one study with its estimated effect size, 95% confidence interval and weight in the meta-analysis. The blue squares represent the effect size of each study and the horizontal lines through these squares show their 95% confidence intervals. The size of the squares is proportional to the weight of the study in question. If the confidence interval crosses the vertical line at zero, it means that the study result is not statistically significant. The rhombus at the bottom of the graph shows the overall effect size (0.19) with a 95% confidence interval. The overall effect test indicates a statistically significant result (p = 0.00).
- Bubble Plot – allows the visualisation of data from three dimensions - the two variable X and Y axes and an additional dimension represented by the size of the bubbles, which helps to identify relationships and trends.
- Funnel Plot – used to assess bias and heterogeneity between studies, helps to identify asymmetries that may indicate publication bias.
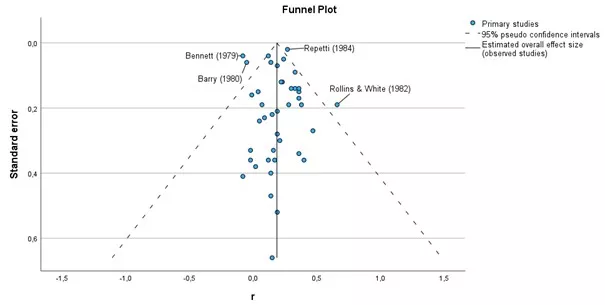
Chart 2. Funnel Plot
The funnel plot suggests that there is no significant publication bias in this meta-analysis because the points are relatively symmetrically distributed around the line representing the estimated total effect size. At the base of the graph are results obtained on small samples with a large standard error, and at the apex are studies obtained on large samples with a small standard error.
- Galbraith Plot – used to assess the heterogeneity of study results, helps identify outliers that may affect the pooled effect.
- L'Abbé Plot – designed to analyse binary data, it allows comparison of the proportion of events in the study and control groups to help identify differences between studies.
The choice depends on the needs of the analyst and the objectives of the analysis. It is possible to select many or even all of them and obtain a complete visualisation for the meta-analysis performed. This is a significant convenience both for the analyst himself when interpreting the results and for the target audience. In addition to the exact values, he or she will also receive intuitive graphs to help understand the phenomenon under study.
Summary
Meta-analysis is a powerful statistical tool that allows analysts and researchers to collectively evaluate the results of multiple studies. Conducting a meta-analysis requires several steps. From data collection and data entry, to heterogeneity analysis (assessing how much the results of individual studies differ from each other), to calculating the pooled effect and interpreting the results. With meta-analysis, more precise and comprehensive conclusions can be obtained, which is already contributing to progress in many fields.
Meta-analysis not only increases the statistical power of analyses, but also allows the identification of patterns and trends that may be crucial to understanding the problem under study. It is therefore worth taking the time to conduct it thoroughly and to use its potential to its full potential.