Let's take a look at an example of a high school diploma showing the results of the matriculation exams. Right next to the information about the points scored, we can see the comment "96% of the exam takers scored the same or lower". This information is the value of the 96th percentile which divides the population of all people writing the final exam into two parts, meaning only 4% of people taking their final exams did as well or better.
QUANTILES AS MEASURES OF POSITION
Location measures are used to determine the value of a variable around which the other values of the variable described by a given distribution are clustered. We divide them into classical measures and positional measures. In this article, we will focus on positional measures, more specifically quantiles.
WHAT ARE QUANTILES AND WHAT ARE THEIR TYPES?
Quantiles are the values of a feature of a given statistical population, which enable its division into specific parts in appropriate proportions. In practice, the most commonly used quantiles are quartiles, deciles and percentiles.
As for the quartiles, we distinguish three which divide the surveyed population into four equal groups, each representing 25% of the observations. The resulting three quartiles – the 25th, 50th and 75th – each divide the observations into two groups in appropriate proportions. Note, the data must be ordered from smallest to largest to compute quartiles; as such, quartiles are a form of order statistic.
- The first, or lower, quartile (
 ), or the 25th percentile, divides a given population into two groups, with the first group being 25% of observations with a value less than or equal to the value of the first quartile. The remaining 75% assume values greater than or equal to the value of the first quartile.
 - The second quartile (
 ), or the 50th percentile, is the median, i.e., it divides the surveyed population so that 50% of the observations take values less than or equal to the median, and 50% of the observations take values greater than or equal to the median.
 - The third, or upper, quartile (
 ), or the 75th percentile, divides the statistical population into two groups, where 75% of the observations are less than or equal to the third quartile, and 25% of the observations are greater than or equal to it.
Let's look at a short example of interpreting quartile data.
An employee of a department of a certain company earns PLN 5,300 gross per month. After a short analysis of the salary distribution of employees in her department, the following quartile values were obtained using PS IMAGO PRO (Table 1).
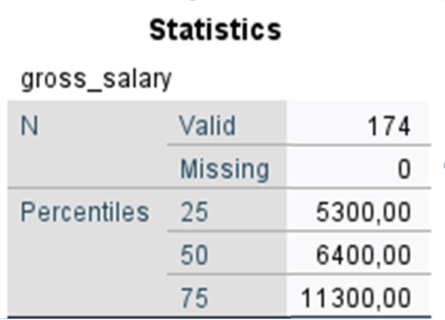
Table 1.
Percentiles of the variable Remuneration
It is worth noting that in PS IMAGO PRO quartiles 1,2 and 3 are presented in the form of 25th, 50th and 75th percentile.
Based on the values of the lower quartile, or the 25th percentile, it can be concluded that 75% of employees in this department boast the same or higher gross salary than the employee in question. Similarly, the interpretation of the upper quartile, or the 75th percentile, will be as follows: 25% of employees earn PLN 11,300 gross per month or more.
In addition, using the values of the quartiles, we can determine the so-called interquartile range, i.e., the difference between the 25th and the 75th percentile, which is a useful way to determine the spread of central observations.
Deciles are values that divide the population into 10 parts. There are therefore 9 deciles, and it is worth remembering that decile 5 is equal to the median.
E.g. decile 4 will divide the sample population in such a way that 40% of the units will have values less than or equal to the decile value, while 60% of the units will have values equal or higher.
Percentiles (centiles) - there are 99 of them. These values divide the statistical community into 100 parts. The 50th percentile is equal to the median.
E.g. the 47th percentile divides the analysed population in such a way that 47% of the cases take values less than or equal to it and 53% of the units take values equal to or higher than this percentile.
WHEN IS IT WORTH USING QUANTILES?
When analyzing the structure of the distribution of a given variable, there may be a situation where the mean does not represent a value typical for a given distribution, e.g., due to the occurrence of extreme values, open category ranges, or when distributions are characterized by strong asymmetry. In such situations, the values of individual quantiles are useful in analyzing the distribution structure of a given variable.
CHILD DEVELOPMENT PERCENTILE CHART
As a footnote, in addition to determining what percentage of high school graduates did better than us in exams, we can also use percentiles to construct a so-called growth chart, which is used by doctors, nurses and parents on a daily basis to monitor a child’s development. More specifically, it is a visualization of the percentile values based on the age of the child and is used to control and evaluate the individual development of the child by comparing his or her characteristics with the developmental norms of a population of healthy children. Most often, the grid shows the following percentiles: 3, 10, 25, 50, 75, 90, 97 or 5, 10, 25, 50, 75, 90 and 95, with the 3rd and 97th and 5th and 95th percentiles determining the so-called normal limit. Such charts most often show the child's height and weight.
HOW TO READ THE PERCENTILE CHART?
Below is the growth chart for boys' height. Individual percentile lines determine the percentage of children who are below their level in each age group. For example, if a boy's height at a given age is on the 25th percentile line, it means that 25% of his peers are shorter than him or the same height. In this way, we can determine and monitor a child's individual development path.
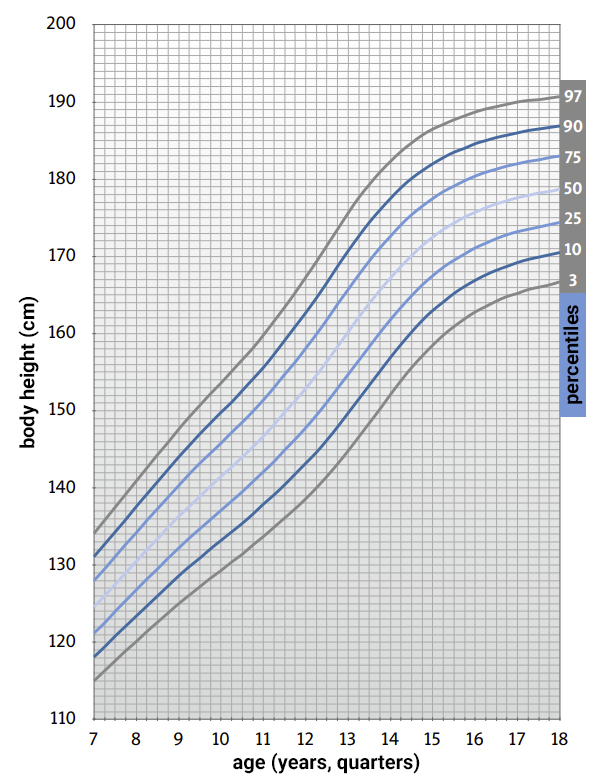
Rysunek 1. Figure 1. Growth chart for boys' height
[1] Sobczyk M. Statystyka, Warszawa, PWN 2007.
[2] Malinowski A. Auksologia. Rozwój osobniczy człowieka w ujęciu biomedycznym, Zielona Góra, Uniwersytet Zielonogórski, 2007.