Reading the article will take you:
3 minutes.
New analytical engine – IBM SPSS Statistics 28.0.1 containing Service Pack 1
New, advanced data analysis procedures
- METAANALYSIS – is based on results of other scientific research and provides for synthesizing and combining them. It may deliver a collective review of the size of the effect of and the reasons for potential variability. It contains, among others heterogeneousness tests, degree of the effects of the study, metaregression and visualizations, which can be used to summarize the results;

METAANALYSIS - Menu

METAANALYSIS - Forest Plot

METAANALYSIS - Funnel Plot
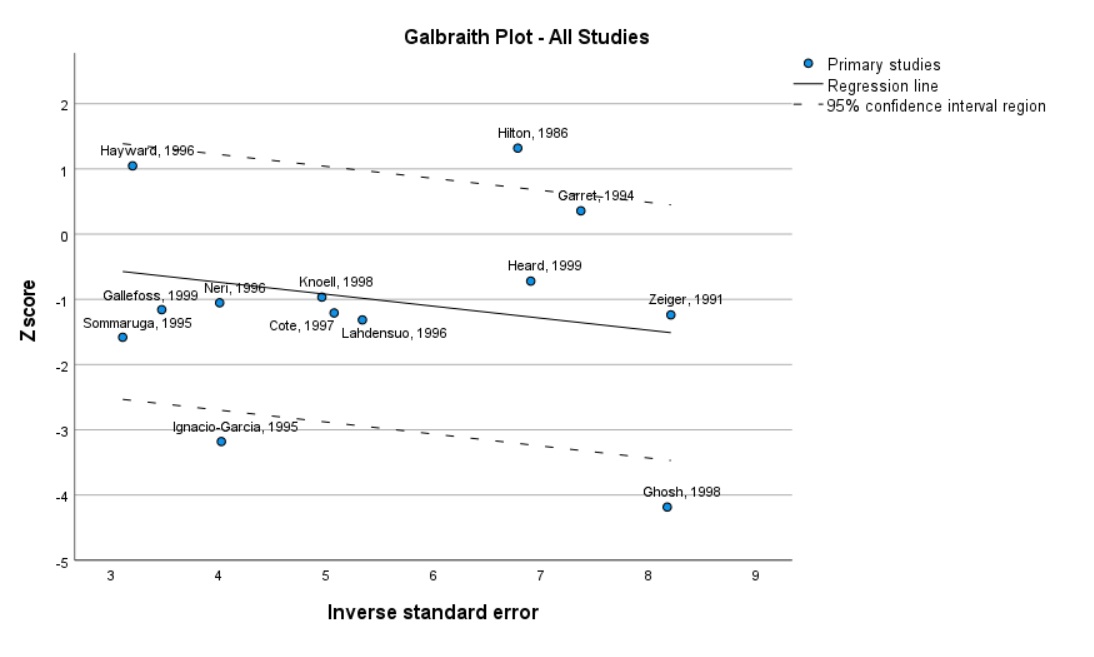
METAANALYSIS - Galbraith Plot
- DEFAULT RIDGE REGRESSION ALGORITHM – a regression method for complex linear and non-linear models allowing selection of the best modeling method using cross validation of the algorithm types indicated by the user.

Default Ridge Regression Summary
Updated and improved statistical procedures
- TEST POWER ANALYSIS – plays a key role in designing a study and later results analysis. In the most recent version all power analysis procedures allow for entering a series instead of a single test power value. The outcome of the procedure is a test power value table and optionally a test power curve chart. Additionally, there is a possibility to determine the size of the effect, as input data for estimating the power of the test or the size of the sample;

Power Analysis - Table

Power Analisys - Total Sample Size
- QUOTIENT STATISTICS – adding PRB index (Price-Related Bias) and the confidence interval for it and removing median-centered variance factor. The quotient statistics procedure makes it possible to easily obtain a full range of summary statistics for a description of the proportions (quotient) of two quantitative variables.

Quotient Statistics
Other improvements in analytical procedures
- adding the selection field "Compare simple main effects " to subwindow "Average EM..." in order to compare between the primary effects nested in other factor levels;
- making corrections in the area "Change contrast" including a change of the sequence of buttons Reference Categories ("Last" and "First") and removing the Change button. Therefore, the selection of reference categories does not need to be approved;
- adding one-sided T test to standard-calculated two-sided T test.

T test
Changes in the output objects
- RELATIONSHIP MAP – allows any connections and influences between variables to be reflected using nodes and linkages. Nodes represent variables and variable categories, and associations the strength of impact between the nodes. The greater the nodes and the thicker the connection lines, the stronger the associations and the influences.

Relationship Map
Improved work efficiency
- FOLDER – enables data analysis to be conducted in an interactive way, thanks to the integration of the Commands window and the Results window functionalities. Folders comprise particular paragraphs containing output elements (commands, tables, charts etc.). Paragraphs containing commands offer full editing and launching options;

Workbook
- IMPROVED SEARCH – is an extension of the existing functionality. It allows presentation of detailed search results e.g. indicating the exact location of the dialog window that is being searched. Additionally, after hovering the mouse cursor on the received result, guidelines regarding the procedure being searched are presented;

Search

Search - results
- TABLE EDIT OPTIONS IN A SIDE PANEL – adding a side panel to the table edit window. Makes table look adjustment easier. After double clicking a table and moving to the Table Editor window a side panel is displayed on the right side, containing options for formatting rows and columns, determining text attributes, defining edge parameters, determining cell formats and defining footnotes and table comments;

Table Editor
- HIGH INTERFACE CONTRAST – added high contrast handling for the program interface (subject to its prior selection in the Windows or macOS system).

High Contrast