Answers to these questions may be the key to increasing basket value through cross-selling. A good starting point for data exploration with cross-selling in mind is the humble crosstab. Technically speaking, the process of the customer selecting products for the basket is like selecting any number of responses to a multiple choice question. Now, we can use a set of multiple responses crossed with itself to get information about the frequency of individual pairs of products occurring together in the basket.
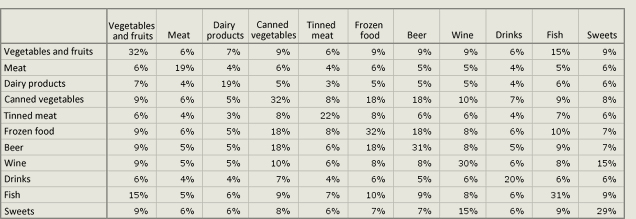
Co-occurrence of product pairs in baskets – coverage
In the table above, the percentage base is all baskets. The value in the cell reflects the percentage of baskets where both product categories are present. Examples of product pairs that often appear in the baskets are:
- ‘beer’ and ‘frozen food’ – 18% of baskets,
- ‘fish’ and ‘fruit and vegetables’ – 15% of baskets,
- ‘wine’ and ‘sweets’ – 15% of baskets.
The diagonal of the table is a cross of a category with itself. The value is interpreted as the average frequency of occurrence of the product in the data. The table below uses the statistic ‘% of N in a row’ which makes for more curious insights.
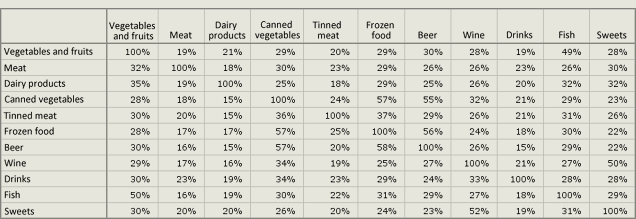
Co-occurrence of product pairs in baskets – confidence
Let's take a look at the pair ‘sweets’ (row) and ‘wine’ (column). After checking all baskets with sweets, it turns out that 52% of them contain wine as well. We can say that we can be 52% confident when offering sweets to a customer who already has a bottle of wine in their basket. The if-sweets-then-wine principle seems to be rather weak, however, it improves wine sales a lot. How do I know it? From the comparison of the confidence value for the principle to the frequency of wine purchase in the whole population (Table 1, 30%). If we were to offer wine to 100 random customers, only 30 would accept (30%). If, however, we apply the principle and offer wine only to persons who buy sweets, the effectiveness would increase to 52%! Such tables can also be used to draw initial conclusions concerning natural customer segmentation. But it is a matter for another post…